Multiplication Times Table Chart 0-12: A Visual Learning Tool
More Than a Grid: Understanding the Color-Coded Design
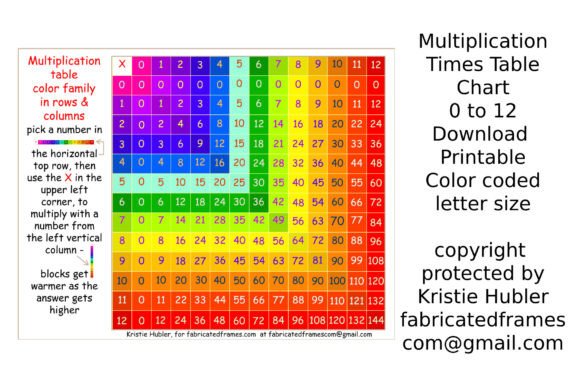
At first glance, a multiplication chart can seem like an intimidating wall of numbers. The Multiplication Times Table Chart 0-12 transforms this experience through thoughtful, intentional design. This isn't just a printable; it's a structured visual learning system built around the concept of number families. The core innovation lies in its color-coded approach. The chart utilizes a carefully selected 12-color palette that flows logically from cooler pinks to warmer tones, mirroring the progression from lower to higher numerical answers. This creates an intuitive visual pathway for a child, helping them see patterns and relationships rather than just memorizing isolated facts.
The design choices are deliberate and child-centric. The prominent red "X" in the top left corner is a clear, universal symbol for multiplication, acting as a constant visual reminder of the operation. The layout guides the eye: find the first number on the vertical left axis, meet the "X" to confirm the action, then locate the second number on the horizontal top axis. The intersecting color block provides the answer. This process turns abstract calculation into a spatial, almost tactile, journey across the page. The use of the Comic Sans font is a practical decision for readability and approachability, especially for young learners or those with reading difficulties. It reduces cognitive load, allowing the child to focus on the math rather than deciphering complex letterforms.
Strategic Applications for Educators, Parents, and Creators
The true value of a well-designed educational resource like the Multiplication Times Table Chart 0-12 lies in its versatility. For parents and homeschoolers, it becomes a foundational design asset for daily math practice. Its clear structure helps children self-correct and build confidence. Teachers can use it as a classroom poster, a desk reference, or a laminated center activity. The color-coding can be referenced in lesson plans—"Look at the blue family for your 4s facts"—to reinforce the connection between number and color.
For designers and creators, this chart offers a case study in effective information design. It demonstrates how visual hierarchy and color theory can make complex data accessible. Bloggers and content creators in the education niche can use it as a lead magnet or a valuable freebie for their audience, establishing authority and trust. Small business owners creating educational products or tutoring services can feature it as a sample of their pedagogical approach. Even crafters and hobbyists can find use in its structured layout for creating math-themed quilts, wall art, or interactive learning games. The chart’s personality is one of supportive clarity, making it a reliable tool across various contexts.
Evaluating Font Choices and Design Systems in Practice
This printable serves as a practical lesson in font pairing and audience awareness. While Comic Sans is often debated in design circles, its application here is purposeful. It prioritizes legibility and a friendly tone for its primary audience: children. This highlights a key principle in modern typography: the best typeface is the one that serves the project's goals and its users, not necessarily the one that is trendiest. For contexts where a different visual feel is desired—perhaps for an older student or a more formal educational setting—the creator offers variations using a custom "Fabric Font." This introduces the concept of a font family or system, where different styles (like a sans serif font for body text or a handwritten font for accents) can work together within a single brand or project.
When choosing any premium font or creative font for your own projects, the logic is similar. Consider the end-user's environment. Is it a web design project requiring a robust sans serif font for screen readability? Is it packaging design needing a script font for elegance? Is it social media graphics that demand high-impact, quick-read display font choices? Always test font pairings for contrast and harmony. A strong brand identity uses typography consistently to build recognition and convey professionalism. This multiplication chart, in its specific niche, achieves that consistency perfectly, proving that even functional tools benefit from strategic design thinking.
Practical Guidance for Implementation
When integrating a resource like the Multiplication Times Table Chart 0-12 into your workflow or teaching, test it in the intended environment. Print it out. Does the color remain distinct on your printer? Laminate it for durability in a classroom setting. For digital use, ensure the PDF scales cleanly. Observe how the learner interacts with it. Do the colors help or distract? This kind of user testing is invaluable, whether you're evaluating an educational tool or selecting a commercial font for a logo design.
For creators, consider how the principles here apply to your own design assets. Could a color-coding system improve the usability of an infographic or a report template? Does your chosen typography support quick scanning and comprehension? The most effective designs, like this chart, blend aesthetic appeal with unwavering functional clarity. They guide the user effortlessly toward the goal—whether that's solving 7x8 or understanding a complex business report. By focusing on this synergy, you create tools and materials that are not only beautiful but genuinely useful and engaging.